

Retirement can be a scary time for retirees who have considerable and even modest portfolios. We want to protect those assets. And certainly the risk tolerance level for most retirees will drop considerably. And that risk tolerance level will often drive the bus with respect to your allocation to bonds and cash and other risk management techniques you might put to work.
While the order of returns does not matter considerably in the accumulation stage, when we enter retirement we face that sequence of returns risk. Years of poor stock market returns early in the retirement funding stage can permanently impair your portfolio and your retirement. And in fact the risk to retirees begins well before that retirement start date. On Cut The Crap Investing I wrote on that with You Should Protect Your Retirement Portfolio Long Before Your Retirement Start Date. Have a read of that article and you’ll see that the Retirement Risk Zone is typically qualified as 5 years before retirement and your first 5 years in retirement. We have to be careful as we approach retirement and in those first few years.
Can a near retiree almost completely de-risk the portfolio and sell a large percentage of their stocks? Sure, it may be emotionally pleasing, but with less stocks in hand it may slightly compromise late accumulation stage portfolio growth. That said, the most important part of it all might be that comfort level and that stress reduction event that comes with greatly lessening that stock component. And let’s face it, some near retirees who’ve planned well and who are lucky enough to have a generous defined pension plan might not need much or any inflation-beating portfolio growth. We’re all snowflakes when it comes to retirement funding, we are all entirely unique in our needs and our situation.
But let’s look at a scenario where a retiree does need their personal portfolio to work very hard; they are counting on that portfolio to deliver a generous component of their ongoing retirement funding needs. It’s time for those hard-earned monies to work for them. On the ‘rule of thumb’ spend rate for portfolios see my Boomer and Echo guest post The 4% Rule: Is There A New Normal for Retirees? You’ll read that historically a retiree with a sensible mix of stocks and bonds can spend at the rate 4%-4.5% of the portfolio value each year, with an adjustment or increase each year to compensate for inflation.
Given that we want some growth in the later stages of accumulation and we need that growth component to potentially earn returns above that 5% range, we do not want to abandon that Balanced Portfolio model, we still need those stocks.
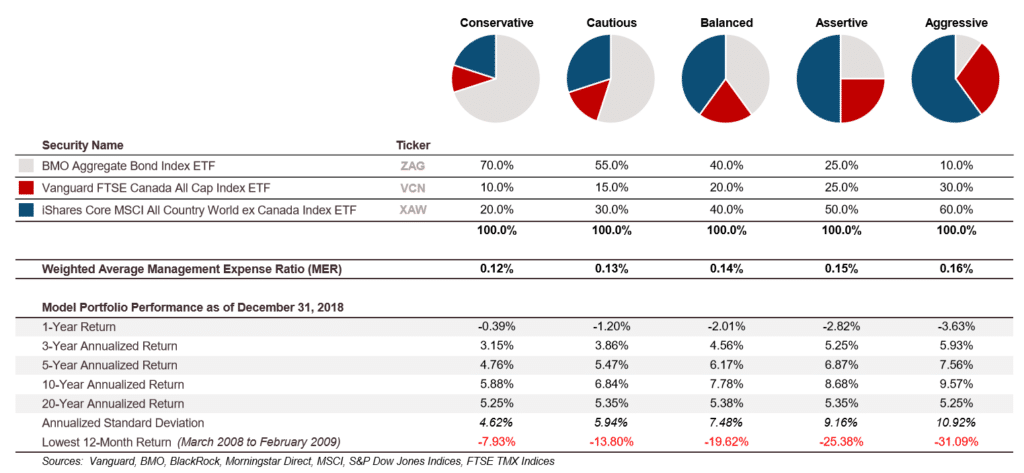
To manage the risks, we want to keep that nice mix of Canadian, US and perhaps International stocks to work in concert with that bond component. And the most conservative range that we might move to is 80% to 70% fixed income. That’s a very conservative mix of course.
The returns might be muted but you might be able to eek out 3% income from your fixed income component (a mix of bonds and GICs) and perhaps if stock markets continue to deliver 9-10% annual you must see a returns breakdown such as this:
- 70% of portfolio @ 3% = 2.1%
- 30% of portfolio @ 10% = 3%
That might give you a return in the 5% annual range if the stock market ‘rally’ continues and the bond market does not come under pressure.
Now it’s time to dollar cost average back into stocks
OK, so you’ve largely de-risked but you want and need your portfolio to work as hard as possible. When you hit that retirement date you can begin to increase your stock exposure over time. You might become a retiree stock ‘dollar cost averager’. Yup, you’ll employ the tried and true technique that many of us employ in the accumulation stage – you’re going to add to your stocks on a regular schedule.
You’ve de-risked and then you begin and continue to add risk. They call this an equity glide path. And this has been described and studied in detail by retirement funding rockstars Wade Pfau and Michael Kitces. Here’s their White Paper on the strategy.
That paper demonstrates that the bond percentage should equal your age mantra has no basis in math. In fact a very conservative de-risking with an eventual equity glide path even beats the typical static allocation approach of a classic 60/40 Balanced Portfolio. From that paper:
“Declining equity glide paths do not necessarily help support retirement success. Static allocations generally fare worse than more conservative starting allocations that rise in equity exposure throughout retirement. Depending on the underlying assumptions, the optimal starting equity exposures are generally around 20 percent to 40 percent and finish at around 40 percent to 80 percent.”
When should you de-risk?
Many financial planners would suggest that you ‘risk-down’ 5 to several years before you need to start harvesting those assets. That could mean many years of a conservative portfolio and the more modest returns that may come with the approach. That said, according to the Canadian Couch Potato site, the returns of the more conservative portfolios are very solid, historically.
If you embraced the de-risking equity glide approach, you might move to that range of 70% fixed income 5 years or more before your retirement date and the date that you need to start harvesting those assets. When you hit that retirement date you would then start adding more stock exposure. The examples used by Pfau and Kitces suggest a very gradual re-allocation to stocks even over a 30 year period. I’d suggest a quicker move to more stocks, perhaps over a 10 year or 15 year period. We typically move through market corrections every several years; using a 10 or 15 year timeline should present a market correction and allow you to grab those shares as they go on sale. This would be a situation where the retiree is taking advantage of lower prices for stock assets, just as would an investor who is in the accumulation stage.
With the de-risking strategy, we might be able to take on less risk and generate better retirement funding results. The study also suggests:
“In scenarios where equity returns are good early on, the retiree is so far ahead it doesn’t matter (relative to achieving the original goal). Rising equity glide paths create a “heads you win, tails you don’t lose” outcome in securing a starting goal. Of course, retirees who are far ahead may choose to decrease their equity exposure later simply because they have a significant amount of newfound wealth.”
Check-in with a retirement specialist
Keep in mind that de-risking and selling stocks creates tax consequences in your taxable accounts. And to discover the optimal order of asset harvesting (pensions to annuities to RRIF to TFSA to taxable) it may be more than beneficial to check in with an advice-only planner. Retirement funding is more than tricky business, there are many moving parts, and strategies and spending plans can change over time. For more on that please have a read of my review of Retirement Income for Life: Spending More Without Getting More.
Thanks for reading, and thanks to Robb for having me back on Boomer and Echo while he’s enjoying his fabulous trip. Leave a message, would you now consider de-risking for retirement? I’ll check in and answer any questions.

Our emotions have a funny way of making decisions for us.
Somehow, they find their way into our finances and can get us into trouble, either through credit card debt, applying for a credit card that turns out quite useless to you, or getting tricked by marketing tactics.
A good credit card is a necessity for everyday life – but they’re also big money makers for the banks. That means they try to lure you in with big bonuses, impressive-sounding rewards, and oh-so-enticing luxury perks.
But, thanks to marketing magic, all might not be quite what it seems. That’s why it is important to find a reliable, unbiased source of information to help guide you through the marketing noise.
Staying informed is the best way to stop ourselves from getting swept away by what we think is an amazing deal.
As a long time credit card and points enthusiast, that’s why I decided to create creditcardGenius from the ground up to be as unbiased as possible. Our credit card comparison tool and rankings are 100% based on a complex math-based algorithm that rates cards solely by their merits and features.
Top 5 credit card marketing tricks (and their antidote)
There’s a lot that goes into the marketing of a product – look, feel, design, colours, texture, colourful wording, and more. They all work together to pull at our heartstrings and to portray a very specific message to consumers. That message is usually: “you need me NOW.”
Credit cards do that too, often in some pretty unexpected ways:
1. Misleading point values
Not all credit card points are created equal. Just because one credit card offers more points doesn’t mean the points are worth more. There’s usually some math involved.
For example, just because a credit card offers 10 points per $1 spent doesn’t mean it has more value than a credit card that offers 1 point per $10 spent.
A common trick is to 10X the usual number of points you earn while making them worth 1/10th the value. That 20,000 point sign up bonus sure does look impressive. At least until you realize it’s only worth $20 compared to the 3,000 mile bonus from another card that’s worth $600.
Our antidote
For each card listed on creditcardGenius, in our brand new Rewards tab, you’ll find the most extensive point value analysis available for every possible redemption value.
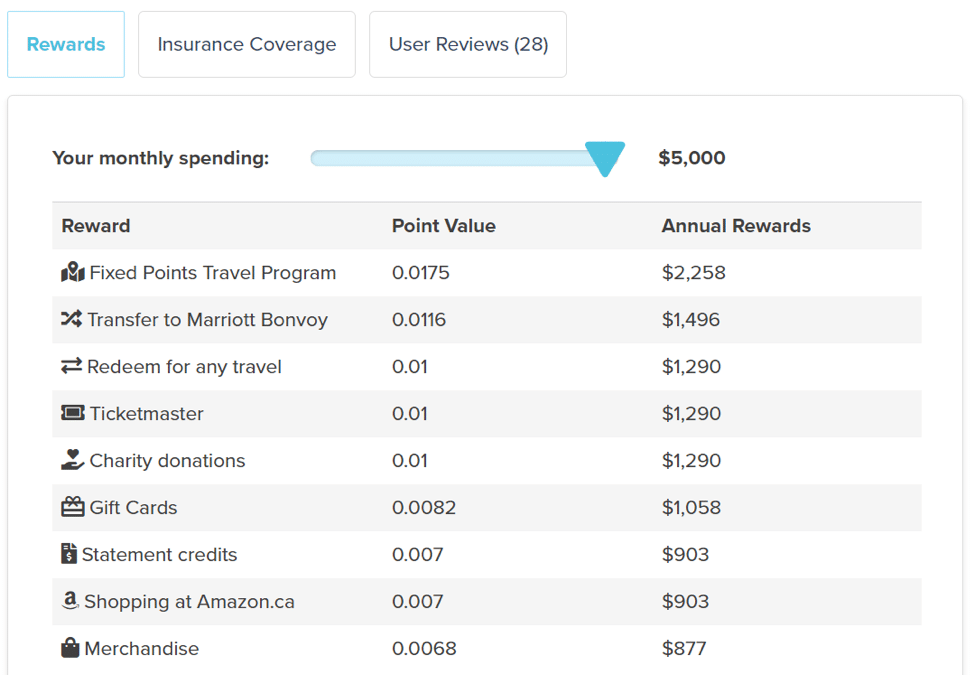
This way, you can easily tell if your desired redemption option provides good value in comparison to other methods. You can also see just how much your points are really worth.
The annual rewards displayed are calculated in real dollars using the estimated point value based on your rewards preferences and typical monthly spending.
Related: How to maximize your American Express Membership Rewards points
For example, if your Rewards preference is Travel, we’ll display the value of the annual rewards if you were to redeem those rewards for travel purchases. If your Rewards preference is Cash, we’ll display the value of the annual rewards if you were to redeem those rewards for statement credits.
If you hover over the Annual Rewards number, you’ll even see the total annual rewards earned when you subtract the annual fee, as well as the average earn rate based on your spending breakdown.
2. Impossibly big bonuses
The special wording used to describe credit card welcome bonuses, for example, can create a false sense of excitement, where you think you’re getting more value than you really are.
A credit card that boasts: “10% cash back on ALL PURCHASES” sounds pretty amazing, until you read further and realize that it’s only 10% for 3 months, and there’s a cap of $100 in rewards earned, and that 10% includes what you’d normally earn anyway so technically it’s only 6% more, and Santa Claus isn’t real after all…
Our antidote
The welcome bonus we display is calculated in real dollars using estimated reward point values that are based on both our extensive research and the main type of reward (cash, flex, or travel) you’ve selected.
This means that if your rewards preference is Travel, we’ll display the value of the welcome bonus if you were to redeem those rewards for travel purchases. If it’s Cash, then the value displayed will be for statement credits, direct deposits, or investment products which can be converted to cash.
The typical earn rate you’d normally get is also subtracted from this welcome bonus to show what you’re really getting on top of your regular spending. This way, you see the real value of the bonus without the false sense of inflation you might get from the special wording or loads of points that have little real value.
3. Enticing design and feel
Even the design of a credit card can influence how you feel about the product. You’ll notice nearly all the premium credit card offerings will have dark, greyscale colours – sleek designs in dark or metallic colours can give you a sense of prestige and mystery.
Brightly coloured credit cards will draw attention each time you use it, encouraging others to look into the product and take notice of it.
These days premium cards are even being made out of lightweight metal instead of plastic, famously saving one man’s life.
Our antidote
Although we display card art, it’s never the main focus. It’s merely a means of identification. The main focus is always on the tangible value you’ll get from each card.
There’s nothing wrong with a nice looking card, but I’ve carried some pretty ugly cards in my wallet because they had the best rewards and features on the market.
4. Unfair comparison
When trying to find the best product, we want a fair comparison. All options should be laid out on the table.
Some online resources use tactics to get you to apply for credit cards provided by their affiliate partners rather than non-affiliated cards by purposely removing apply links, completely omitting certain cards from their database, editorial ratings that can be quite biased by compensation, and more.
In the end, you may still end up with a product you never really wanted.
Our antidote
Our 190-card database is the most comprehensive in Canada. All Canadian credit cards from every major issuer are listed, regardless of compensation.
This was a tough decision to make because, like any business, creditcardGenius needs to make money. But, as someone who would use creditcardGenius myself, I knew omitting cards is something neither you or I would want.
That’s why the results on our Compare Cards page and in our annual best credit card rankings are produced purely by our unbiased all-inclusive math-based algorithm.
On the Compare Cards page you’ll get results that respond in real-time to any tweak in your personal preferences. In the rankings you’ll get the top cards according to a pre-configured set of preferences like “Travel”.
5. Ignoring the big picture
Credit card marketing often ignores the bigger picture of your personal situation and needs and instead focuses on 1 or 2 enticing features to draw you in.
They don’t look at what other cards you already have in your wallet and they don’t try to understand what you care about.
I liken this to buying a house and only checking to see if the roof and the front door are good quality and to your liking – no one would do that right? That’s what home inspections are for.
Then why would you only look at the number of points in the welcome bonus and the annual fee when choosing a credit card?
Not to mention what’s best for someone else might not be what’s best for you.
Our antidote
For a truly comprehensive analysis of your entire wallet and personalized recommendations tailored to your specific needs, there’s Rate Your Wallet – a 3-minute long, easy and fun quiz that shows you whether or not your current cards make the cut, and what alternatives will give you max rewards for your spending. All based on your personal preference and spending profile.

On closer look…
So, what does your credit card look like when you take away all the marketing hype and noise? Is it as good as it seemed at first, or do you see it in a new light?
Stephen Weyman is the co-founder of HowToSaveMoney.ca and creditcardGenius.ca ‒ a purely math-based credit card comparison engine, comparing more than 50 features of over 190 Canadian credit cards, so you can maximize your rewards. Rate Your Wallet is a 3-minute quiz that tells you if your card is worth the keep.

Canadians value few things more than a home that is owned outright. This might be especially true for retirees. The thinking seems to be that once your mortgage is paid off, your housing expenses evaporate. Unfortunately, this could not be further from the truth.
The alternative, renting, is often frowned upon. Renting is seen as throwing money away. The reality is that renting in retirement can make a lot of sense, both financially and psychologically, when it is properly understood.
The first step to accepting renting as a sensible housing choice is understanding the financial aspect of the decision. To compare the financial implications of renting and owning we need a common ground. That common ground is unrecoverable costs.
Unrecoverable Costs
Rent is an unrecoverable cost. It is paid in exchange for a place to live, and there is no equity or other residual value afterward. That is easy to grasp.
Owning also has unrecoverable costs. They are less obvious and usually get missed in the renting versus owning discussion. An owner of a mortgage-free home still has to pay property taxes and maintenance costs, both unrecoverable, to maintain their home. Each of these costs can be estimated at 1% of the value of the home per year on average.
In addition, an owner absorbs an economic cost for keeping their capital in their home as opposed to investing it in stocks and bonds. This economic cost, or opportunity cost, is a real cost that an owner needs to consider. Estimating this portion of the cost of owning is harder to do. It requires estimating expected returns for stocks, bonds, and real estate for comparison with each other.
Expected Returns
Estimating expected returns is not an easy task; it starts with understanding historical risk premiums. The market will demand more expected return for riskier assets, and this relationship is visible in historical returns.
For stocks, bonds, and real estate, the Credit Suisse Global Investment Returns Yearbook offers data going back to 1900. Globally, the real return for real estate, that’s net of inflation, from 1900 through 2017 was 1.3%, while stocks returned 5% after inflation, and bonds returned 1.9%. If we assume inflation at 1.7%, then we would be thinking about a 3% nominal return for real estate, a 6.7% nominal return for global stocks, and a 3.6% nominal return for global bonds.
To keep things simple and conservative, we will assume that real estate continues to return a nominal 3%, while stocks return an average of 6%, and bonds return 3%.
The Cost of Capital
With a set of expected returns, we can now start thinking about the cost of capital. Every dollar that a home owner has in home equity is a dollar that they could be investing in a portfolio of stocks and bonds. A retiree is unlikely to have an aggressive portfolio of 100% stocks, so we will use the 5.10% expected return for a 70% stock and 30% bond portfolio. The 2.10% difference in expected returns between the portfolio and real estate is the opportunity cost carried by the owner.
It is important to note that asset allocation, which is a big driver of these numbers, will depend on many factors including other sources of income like pensions, tolerance for risk, and portfolio withdrawal rate.
Comparing Apples to Apples
Adding up the unrecoverable costs, we now have 4.10% of the home value between property tax, maintenance costs, and the cost of capital. This is the figure that we can compare to rent.
A $500,000 home would have an estimated annual unrecoverable cost of $20,500 ($500,000 X 4.10%), or $1,708 per month. If a suitable rental could be found for that amount, then renting would be an equivalent financial decision in terms of the expected economic impact.
Other Financial Considerations of Renting
So far, we have looked at pre-tax returns. Taxes could play an important role in this decision. Increases in the value of a principal residence are not taxed. Income and capital returns on an investment portfolio are taxed. This could have an impact on our 4.10% figure during life. It could also have important implications from an estate planning perspective; large capital gains on a taxable investment portfolio could be costly at death. On the other hand, real estate is less liquid than a portfolio of stocks and bonds, and it has high transaction costs.
Diversification is another important factor in this comparison. We have used a 3% expected return for real estate based on the history of global real estate returns. The reality for a home owner in Canada is that they own a single asset in a single country. They are unlikely to get anything close to the expected return of the asset class. They may do far better or far worse with no way to predict the outcome. This increased dispersion of potential outcomes increases the risk for an owner, especially if a large portion of their wealth is in their home.
Renting results in a predictable cost. Having a fixed (though, increasing) monthly expense goes a long way in retirement cash flow planning. A home owner could be required to spend a large lump sum at any time for maintenance, repairs, or modifications to accommodate aging.
Non-financial Considerations of Renting
Understanding that renting can be equivalent from a strictly financial perspective, there are a ton of non-financial considerations. In most cases, these will end up being the basis of the rent versus buy decision for a retiree, especially when the financial equivalence of renting and buying is properly understood.
Renting is less of a commitment. A retiree may move as their children settle, their interests evolve, or their needs change. Not only do real estate transactions come with high costs, but there is no way to predict where the relevant real estate markets will be when you want to move, which introduces real estate price risk. Stocks and bonds also have price risk, but a retiree might be drawing 3.5% of their portfolio each year to cover expenses; this is quite different, in terms of risk, than selling 100% of an asset.
Renting is generally less of a hassle. Forget about the costs of maintaining a home – what about the time? It is easy for a home owner to spend substantial time maintaining their home. This could be seen as a hobby for some, and a hassle for others.
Renting simplifies your estate. Even if we assume that a home and a portfolio will result in a similar amount of after-tax inheritance, in many cases, inheriting a home can be a burden. Maintaining it could be expensive, and selling is not always easy.
Owning has the benefit of flexibility. There is nobody who is able to evict you, increase your rent, or disallow renovation projects.
Renting in Retirement
Robb detailed many more pros and cons of both renting and owning in retirement in another post. Ultimately this decision comes down to a combination of sensible financial decision-making, long-term planning, and personal preference.
I walked through the numbers on the rent versus buy decision in a recent YouTube video, and did a more detailed analysis in this paper.
Benjamin Felix is a Portfolio Manager with PWL Capital in Ottawa. PWL Capital is a wealth management firm that builds diversified portfolios for clients using low-cost mutual funds and index ETFs. You can find more from Ben on his Common Sense Investing YouTube channel, and his weekly podcast, the Rational Reminder, co-hosted by Cameron Passmore.