
I’ve been using TD’s discount brokerage since 2009 when I made the switch from mutual funds to DIY investing. At that time, the TD Direct Investing WebBroker platform left much to be desired. The legacy web design of TD WebBroker was clunky and difficult to navigate (with 55 different navigational links!), trades cost $29 each way, and the platform offered little in the way of personalized account reporting.
TD took a lot of heat over its lack of innovation as an online broker – most notably in The Globe and Mail’s annual ranking of discount brokers, where TD Direct Investing graded out as a mediocre C in 2013. After addressing the account reporting tools and adding U.S. dollar RRSP accounts, TD moved up a grade with a solid B, but that came with a caveat:
“There’s room for TD to move higher if it finishes the job of modernizing a website that still parties like it’s 1999.”

TD Direct Investing WebBroker Platform
That all changed at the end of 2015 when TD Direct Investing took its TD WebBroker platform to the next level. In fact, I’d say the new design rivals that of the nimble robo-advisor start-ups in terms of the overall user experience, simple navigation, and design.
Add in their best-in-class performance reporting, research, and educational tools (including expert webinars and videos), and you can see why TD leaped ahead of every other big bank brokerage in last year’s online broker rankings.

I switched from the old WebBroker platform to the new one back in December, so I’ve had a chance to play around with the tools and features for a few months now. Here’s what I like:
New and simple home screen design
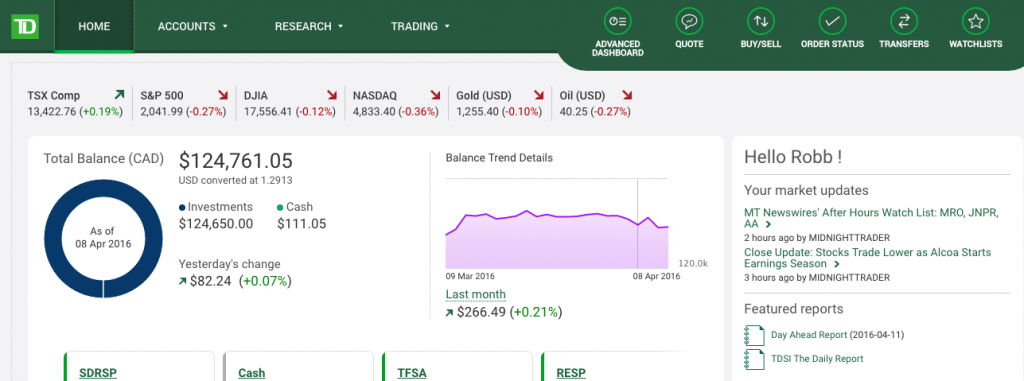
It was a nice transition going from 55 navigational links on the home screen down to just a handful of buttons on a dashboard. You get a snapshot of today’s market activity at the top, plus some notes and featured reports along the sidebar. The main box shows you all of your accounts, total balance, yesterday’s change, plus a nice graph that depicts your balance trend for the past month.
From there you can breakdown your accounts into four main categories: holdings, activity, performance, and gain & loss:
Holdings
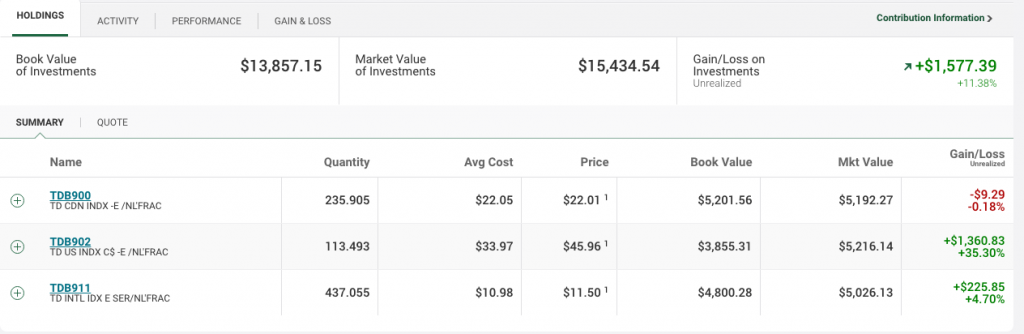
A typical looking dashboard and overview of holdings that you’d expect to find from an up-to-date online broker. Here you can find the number of holdings in your account, along with details such as the number of shares, average cost, market price, book value, market value, plus your overall gain or loss by security.
Account Activity

Breaking down your account by activity allows you to view the details and history of each transaction. In the above example, you can see a monthly contribution, the purchase of mutual fund, a dividend reinvestment, and a deposit of the Canada Education Savings Grant based on the $400 contribution (split into two deposits because this is an RESP family plan for two children).
Performance
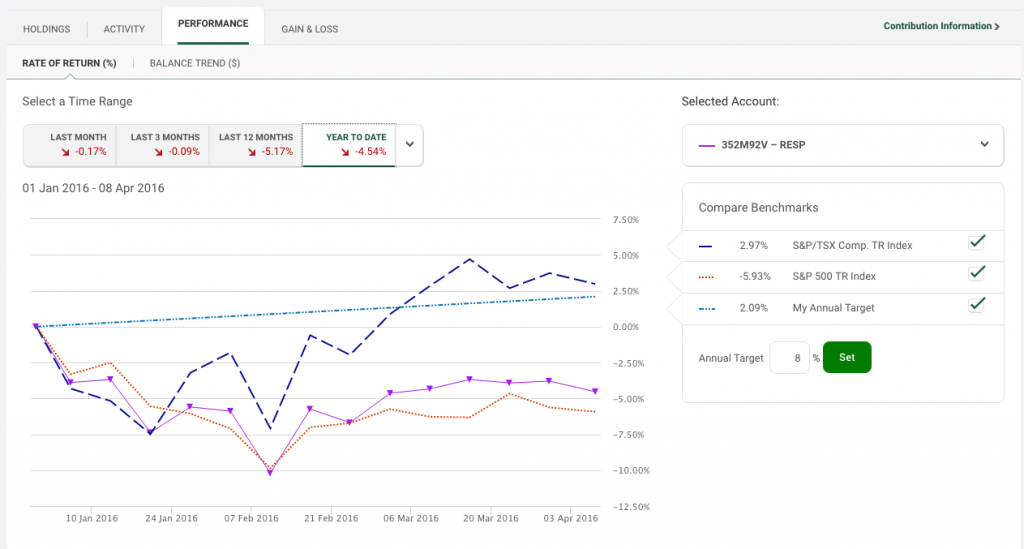
Without a doubt the coolest and most useful tool in the TD Direct Investing WebBroker platform is the performance section. Here you can see your rate of return by account, broken down into common time-periods such as last month, last 3 months, last 12 months, and year-to-date. You can also set a custom date range or view the account and its rate of return since inception:

The only downside to the custom date range feature is that the data only goes back to December 31st, 2010.
I like that I can set my own annual target rate of return – in this case, it’s 8% – and then compare your actual rate of return to not only your target rate, but also other benchmarks such as the S&P/TSX Composite Total Return Index and the S&P 500 Total Return Index.
As you can see above, my RESP portfolio is up 52.86% since inception, and that works out to 10.55% on an annualized basis. Those results handily beat the TSX (9.53%) and my annual target (38.48%) over that timeframe, but can’t keep pace with the roaring S&P 500, which was up 101.63% since 2012.
Balance Trend

If you want to see the impact that deposits or withdrawals have on your portfolio and its rate of return then just toggle over to the “balance trend” view. As you can expect with an RESP portfolio, especially in the early stages, the majority of the growth is coming from new deposits rather than changes in market value or dividends.
It’s worth noting that TD Direct Investing uses the time-weighted rate of return method to calculate investment returns. This method takes into account any deposits or withdrawals that affect the portfolio.
Balance trend is a nice touch for those who prefer to see the value of their portfolio grow in dollar terms rather than in percentages.
Gain & Loss
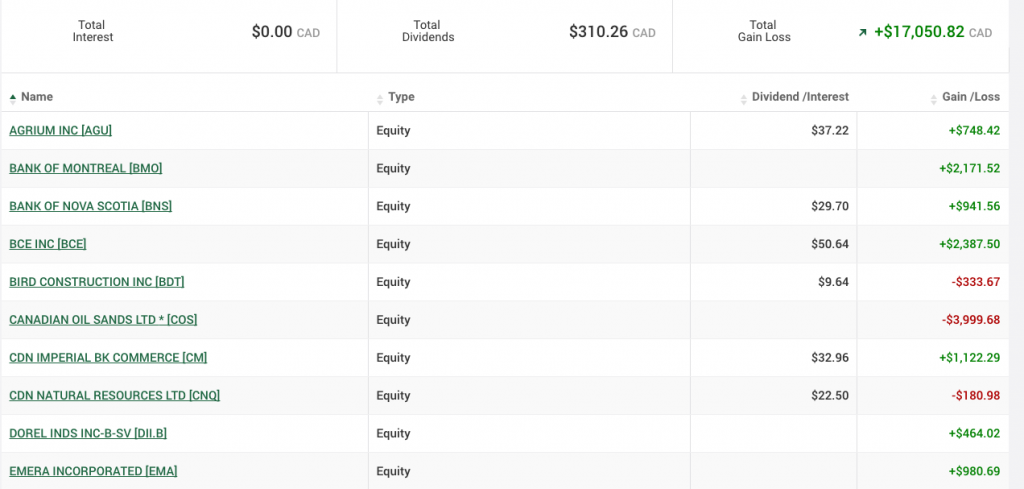
Another new and interesting feature in the newly updated TD WebBroker platform is the Gain & Loss section. Orion Szathmary, TD’s manager of investor education, told me that gain and loss reporting gives investors the opportunity to zero in on important information such as dividends and interest, as well as capital gains and losses. You can break this information down by individual security, by account type, or by registered vs. non-registered accounts.
Szathmary explained that when investors decide to sell a stock, for example, that information no longer appears on the main dashboard or holdings screen. Investors lose the ability to see the impact of that stock on their overall portfolio gains or losses. With gain and loss reporting, this information is readily available and easily sortable going back several years.
In the above example, you can see the gains and losses from my RRSP account in the year when I sold my dividend stocks. So now, anytime I get the itch to pick stocks again, I can just view this report and remind myself of the bath I took on Canadian Oil Sands stock in 2015. Problem solved.
Top Movers
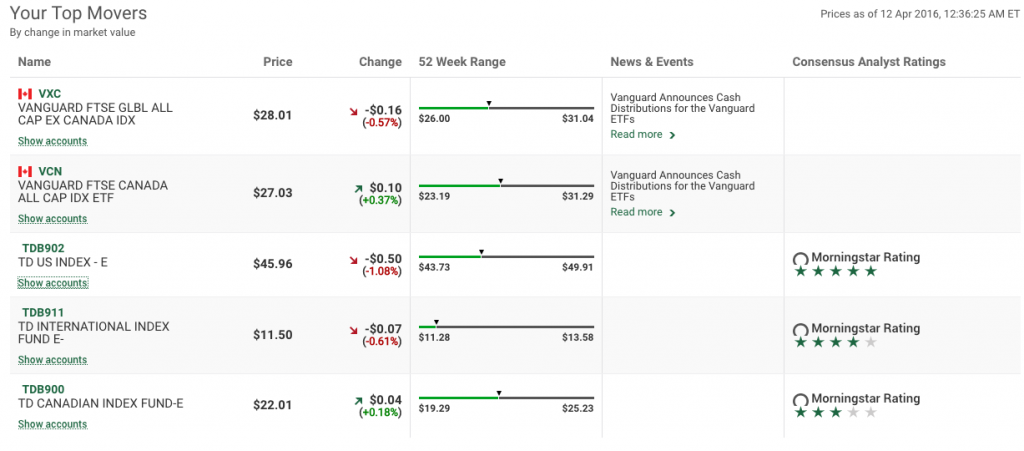
Finally, one section that stood out for me is called Your Top Movers and it sits on the home screen dashboard just below your account breakdown. This report shows you the individual securities that are having the biggest impact on your portfolio by change in market value. It highlights any news or events that may be affecting the security, and shows the current analyst ratings from Morningstar. I could see this snapshot being really useful when I owned dividend stocks and could follow the biggest winners and losers.
Final thoughts on the new TD WebBroker Platform
I’m just a simple index investor, so I know I’ve only scratched the surface of some of the new TD WebBroker features that are now available. Even with its clunky old platform, TD always prided itself on having top-notch research and screening tools. They’ve become more active in investor education – both for beginners and more sophisticated investors. For example, active traders, such as the ones who trade options, have a number of new tools at their disposal, including updated and powerful search features that make it easier to find option contracts.
I’ve become obsessed with transparency and simplicity when it comes to investing and financial planning, and that’s why I was really pleased to see the changes made to the TD Direct Investing WebBroker platform. It allows me to keep tabs on my indexing portfolios, track my performance, and compare them to several relevant benchmarks. The new dashboard gives me an excellent overview of my accounts – just enough to see what’s happening in my portfolio, relative to the market.
I’m not sure if TD, or any online broker for that matter, pays much attention to reviews or rankings in blogs and newspapers. For what it’s worth, I’d give TD’s newly revamped TD WebBroker platform an ‘A’ for overall experience.
When my husband and I celebrated our first Christmas in our new home, we bought the perfect Christmas tree and set it up in front of the window. There it sat, bare of ornaments for several days. We were each waiting for the other to begin. You see, when I was growing up my Dad always put up the lights and my Mom, brother and I decorated the tree. In my husband’s family his Mom strung the lights and the kids decorated. We had different expectations because we were raised differently.
Similarly, the attitudes each of our parents had about money more than likely shaped those money attitudes we hold ourselves, today. Regardless of whether we grew up in a lower income, frugal household, or a wealthy, free-spending one (or something in between), we learned spending patterns from our parents as well as certain money “messages” such as:
- Money doesn’t grow on trees.
- I work hard; I deserve to spend money on myself.
- I don’t spend much time with the children so I’ll make it up to them with expensive gifts.
- Always save for a rainy day.
- You have to put in a good day’s work to get a good day’s pay.
As the years pass, and you gain experience in the world and meet others who have more – or less – money than you and have different family “rules,” you continue to develop different money behaviours that may still be in line with what your parents taught you – or may be the complete opposite.
Meet William and Benjamin
When Will and Ben were growing up, their father worked at lower paying jobs and was often unemployed. Their mother picked up occasional part-time work. Money was often especially tight so it was spent only on the bare necessities. The brothers ate starchy, low cost meals and wore clothing from the thrift store that was usually too small or too large. No “frivolous” spending was allowed.
After graduating from university, Will and Ben each obtained well-paying and secure professional jobs.
Will continued living his parents’ lifestyle. He ate cheaply, wore inexpensive clothing and rented a small, sparsely furnished apartment. He spent very little on entertainment and friendships. What he did have, however, was an enviable portfolio of very conservative investments. His greatest fear, even though it was unlikely, was losing his job.
What money means to William is security, stability, building a nest egg, and having peace of mind.
On the other hand Ben totally rebelled against his parents’ money attitudes. He is free spending and generous with his friends and family and often rewards himself with expensive clothing, merchandise and trips. He is a risk taker with his investments, which sometimes works out for him, but he often faces large losses.
For Benjamin, money represents luxuries, respect, enjoyment of life, being generous with loved ones, and having experiences.
Does how you spend your money align with your values?
Do you say that your family is the most important thing in your life, yet put in twelve-hour days, six or seven days a week at work? I’m sure your children would rather have good memories of their parent instead of a big house and lots of toys.
Are you grinding it out at a boring job you hate because of the great pay?
Do you try to keep up with the Joneses with an expensive house, auto, electronics, etc. even though it’s draining you?
Is money a means to an end – or an end in itself?
Our relationship with money – and how we earn and spend it – says a lot about who we are. Is it relating the real you?
What does money mean to you?
Are you happier when you’re saving or spending?
Can you spend or give money away easily, or are you unwilling to part with a cent?
Do you always want more no matter how much you have? How much is enough?
Do you spend money on others but never on yourself?
Do you value today’s consumption over consumption in the future?
Are you unwilling to take a chance, even to obtain possible rewards? Or do you embrace risk?
Final thoughts
Money is more than simply the coins, paper or plastic used to acquire goods and services. It is linked to unconscious, complex emotions, feelings and behaviours. Each person’s financial behaviour today is based on past observations, experiences and what they were taught.
Dig deep down and discover what money really means to you. Your definition of what money means will affect every decision that you make that has a $ attached to it.
This is a guest post by Daniel who blogs at Urban Departures to help families set their personal finances on autopilot. His knack for saving fuels his love for travelling. He shares his secrets in Grow Them Savings, a one of a kind course designed to simplify investing for people with better things to do.
There has been an awakening. Have you felt it?
There comes a time for every investor to embark on a journey when they begin investing. Like the farm boy from Tatooine or the scavenger from Jakku, every investor has to start somewhere. There’s a galaxy full of different investing styles, strategies and products and it can be difficult to navigate without a little guidance. Who better to lend a hand, than our friends from a galaxy far, far away.
“Adventure. Excitement. A Jedi craves not these things.” — Yoda
A ride on a fast ship, perhaps with two droids and no questions asked, to wealth and financial freedom is an appealing proposition. Yet the potential to lose everything is an equally sobering reality. There is risk involved with investing. It is possible to pick a hot stock which leads to quick riches, but it is equally as possible for the same stock to become worthless. If recent swings in the market are any indication, uncertainty is the only thing that is consistent.
An investment that doesn’t improve your quality of life and keeps you up at night is a speculative gamble. It probably isn’t worth the time and effort.
“That’s not how the Force works.” – Han Solo
Gambling with a hot hand in Sabacc might net you a tidy sum, but investing is not a way to get rich quick. In the short term, equities can experience dramatic volatility and substantial losses. Investors, who sell at the first sign of a dip and buy during recovery, may miss out on market gains by trying to time their investments.
Yet many continue to do exactly that. These emotionally charged decisions, driven by fear or greed, come at a cost of lower returns. The chances of losing money when holding investments for a short period of time, are much higher.
Historical evidence suggests patient investors are rewarded over the long term. For the period 1926-2015, the S&P 500 has always returned a positive gain for holding periods of 20 years. The longer the investment horizon, the higher the probability of experiencing gains in the stock market.
“It’s a trap!” — Admiral Ackbar
It makes sense to seek out professional help but the wrong advice can be costly. Like the rebel attack on the second Death Star, you won’t see it coming until it’s too late. Banks operate in the best interest of their shareholders. Financial advisors earn commissions off the investment products they recommend, presenting a very clear conflict of interest.
The media only add to the commotion. The financial industry, as well intentioned as they may be, is not bound by a fiduciary duty- an obligation to act in their client’s best interest.
“Sir, the possibility of successfully navigating an asteroid field is approximately 3,720 to 1.” – C-3PO
Wall Street (and Bay Street) investment firms employ well-paid teams of PhDs, computer scientists and mathematicians that work full time developing sophisticated analyses to identify stocks to beat the market. Yet, even they don’t always get it right.
An alternative to picking individual stocks are mutual funds, where fund managers work to deliver market beating returns. While it is possible for some mutual funds to outperform the market, it is virtually impossible to know beforehand which funds will do so. The majority of mutual funds fall short of their benchmark after fees.
For the average investor, consistently outperforming the market is a pursuit with overwhelmingly high odds. Picking individual stocks and successful mutual funds has little to do with knowledge and skill and more to do with timing and luck.
“That’s not true. That’s impossible.” Luke
Not convinced? Don’t let your feelings cloud your judgement. Not many have the skillset to best highly qualified researchers in picking winning stocks and common mutual funds don’t fare much better.
Mutual fund fees in Canada are the highest in the developed world. Morningstar’s Global Fund investor Experience 2015 Report found the average mutual fund expense ratio in Canada was 2.35%. While it might not seem like much, Canada’s D- score ranks last among the 25 countries studied.
According to the latest SPIVA Canada Scorecard comparing actively managed mutual funds against their benchmarks, 60.38% of actively managed Canadian Equity mutual funds did not beat the S&P/TSX Composite index over the last 12 months studied. Over a five year period, that percentage jumps to 77.03%.
Similarly, 83.33% of actively managed U.S. Equity mutual funds underperformed the S&P 500 in one year, jumping to 96.84% over a five year period.
“Search your feelings. You know it to be true.” – Darth Vader
It is possible to outperform the market. The SPIVA study proves that 23% were able to do so consistently over the last five years with Canadian equities. Diligent value and dividend investors disciplined enough to stick to their strategy can also perform very well over the long term.
The trade off, however, is to exchange time and effort for a chance at picking winning stock or fund.
For the average investor, with limited time and resources at their disposal, it is less likely to beat the market. It is just as effective to take the guesswork and luck out of the equation all together and accept market returns with index investing. Investors who did over the last five years beat out 77% of professional fund managers, after all.
“Stop taking my hand.” – Rey
There comes a point in every personal finance journey where the need to invest becomes unavoidable. While it’s daunting to take the first steps, it doesn’t take much effort to get started with an index portfolio; a low cost, diversified portfolio can be funded with as little as $100. It doesn’t take long to become comfortable and confident in a successful strategy.
With a little effort and only a few hours to manage a year, a seasoned investor, you can be.